2026-11-07 · 11 min read
Process Graph: See the Automations That Run When a Record Is Saved, in Order
Set up a scan (objects, Fast or Full, Customise), read the Dashboard and Map, and work through six real use cases from field overwrites to blocked saves.
When an Account is saved, Salesforce may run before-save flows, before triggers, validation rules, after triggers, workflow rules, after-save flows and roll-up summaries, in a fixed order. When a field changes unexpectedly or a save is blocked, the question is always the same: which of these did it? Process Graph scans the objects you choose and lays out the automations it can read in execution order, with the fields each one reads and writes. It reads active flows only, never reads managed-package Apex code, and says in the report what it left out.
Version 1.1.13 adds a guided setup screen, a Full mode that reads every active record-automation flow in batches, and Customise to choose what a scan reads. (1.1.9, the previous version, has a Fast/Full switch but no setup screen and no Customise.) Every screenshot below is from a live Consumer Goods trial org.
Setting up a scan
Open Automation → Process Graph. Before a graph exists, it opens on a three-step setup screen.
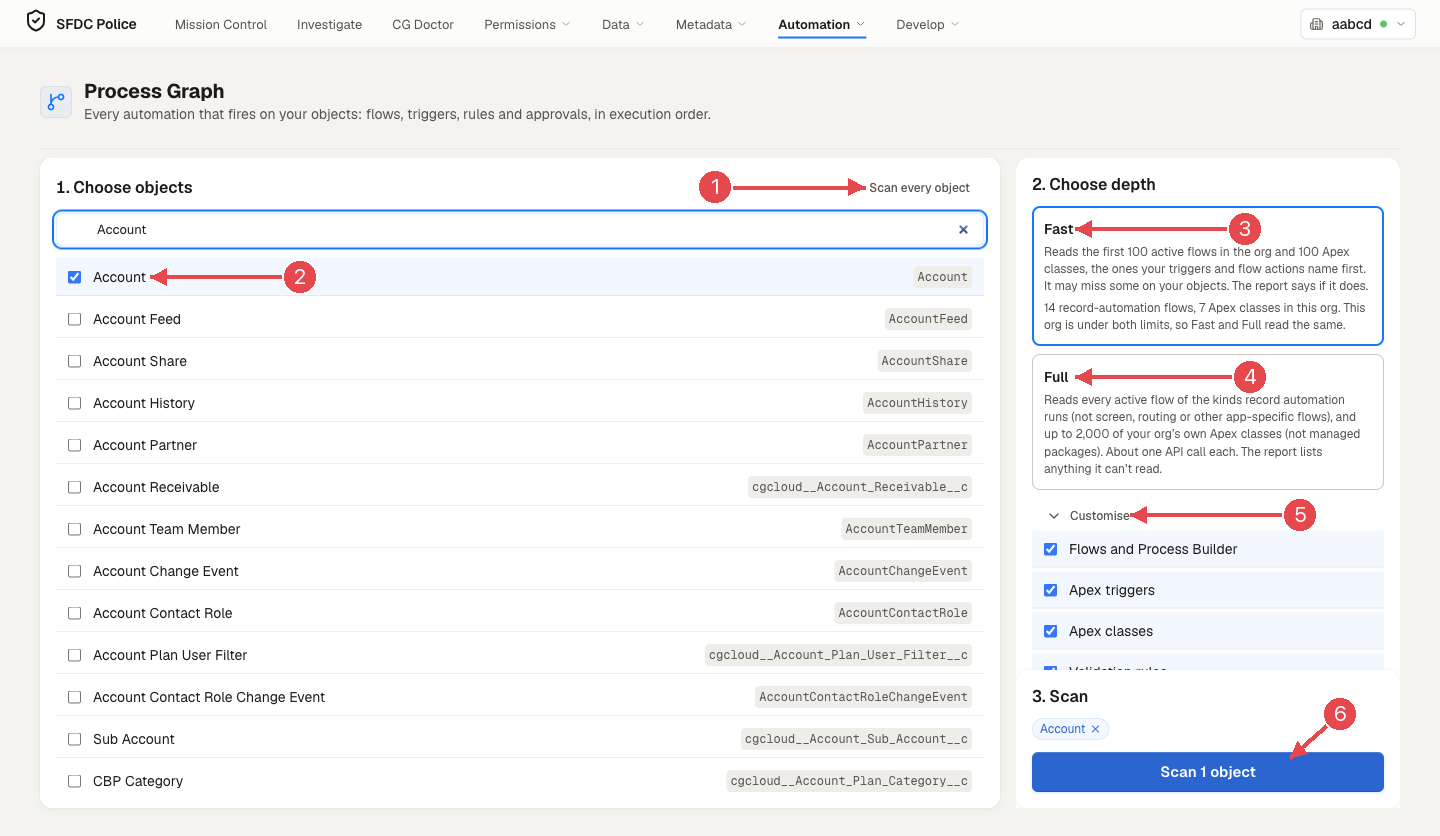
1 Scan every object. 2 Pick objects. 3 Fast. 4 Full. 5 Customise. 6 Scan.
1. Choose objects. Tick the objects you care about. The checklist opens with the objects most automation runs on, then your own custom objects ahead of package ones; a search ranks by relevance; ticked objects rise to the top. Scan every object scans every object automation can run on. It leaves out objects Salesforce marks as not triggerable (change events, feeds, history, sharing and similar), and shows the object count and expected API calls in a confirm before it starts.
2. Choose depth. The cards show real numbers for this org:
- Fast reads the first 100 active flows in the org and 100 Apex classes, starting with the classes your triggers and flow actions name. It may miss some on your objects, and the report says if it does.
- Full reads every active flow of the kinds that run on records (not screen, routing or other app-specific flows) and up to 2,000 of your org's own Apex classes. Managed-package code is never read. It costs about one API call per flow and per class, so before reading flows SFDC Police checks your API budget against the number of flows, then reads 25 flows at a time with a progress count. You can abort between batches.
On our org the card says "14 record-automation flows, 7 Apex classes in this org. This org is under both limits, so Fast and Full read the same." On a large org that line tells you whether Fast is enough.
Customise has one checkbox per kind: flows and Process Builder, Apex triggers, Apex classes, validation rules, workflow rules and email alerts, approval processes, and formula and rollup fields. All are on by default and at least one must stay on. Untick a kind and the scan makes no calls for it. The report, the banner and the field tooltips then say it was skipped, and any answer that depends on it (such as whether two automations can overlap on a field) is withheld rather than guessed.
3. Scan. Click Scan N objects. The page shows the phase and count; Abort stops it (it says Stopping while the last requests return).
Reading the result: Dashboard
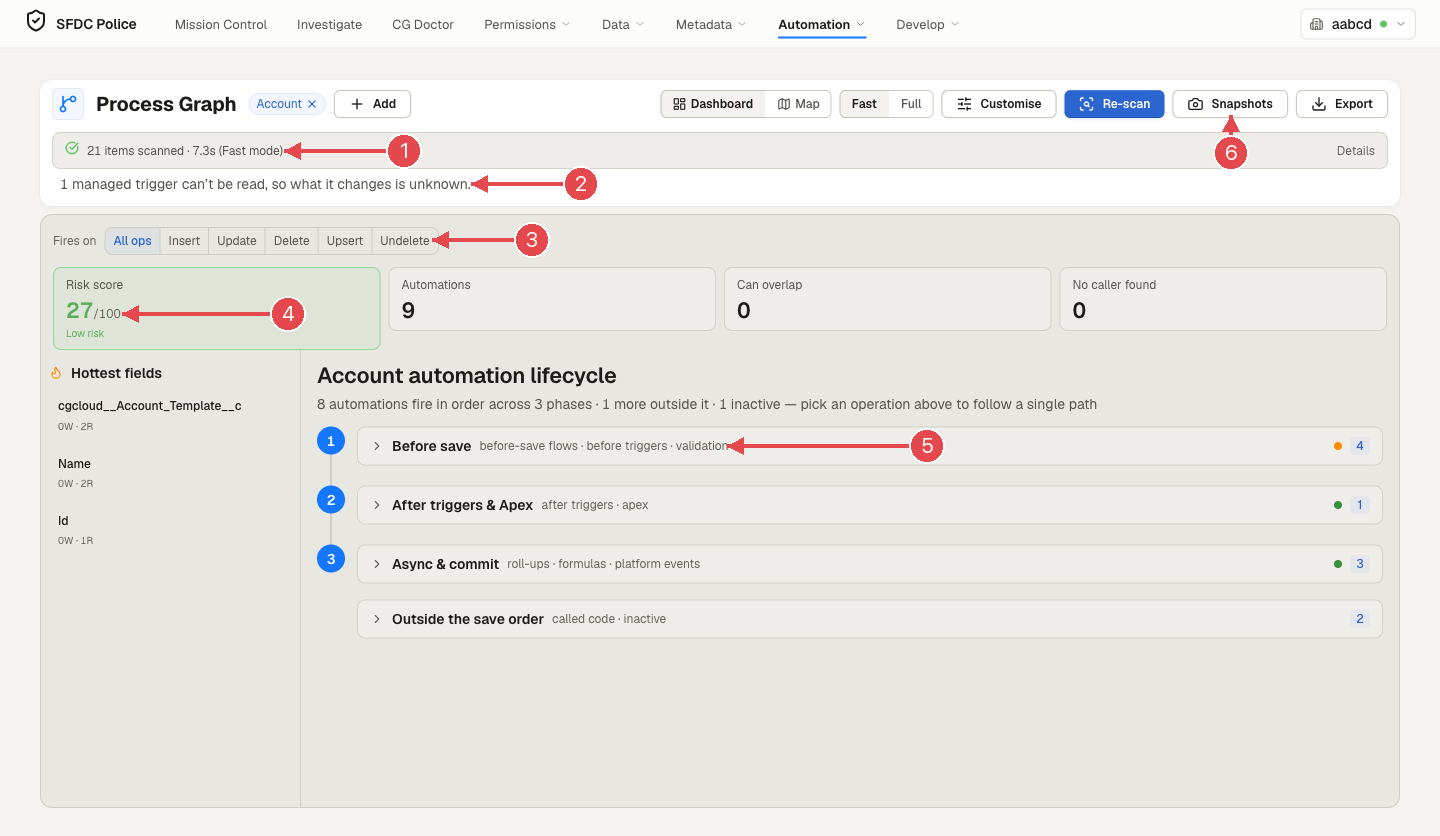
1 What the scan read, and how long it took. 2 What it couldn't read. 3 Filter by operation. 4 Risk score. 5 The save order, phase by phase. 6 Snapshots.
- The coverage line says what was scanned ("21 items scanned · 7.3s (Fast mode)"); Details lists it.
- Notes name the gaps honestly: "1 managed trigger can't be read, so what it changes is unknown."
- Fires on filters by operation: Insert, Update, Delete, Upsert, Undelete.
- The cards count Automations, the fields that Can overlap (two automations proven to change them on the same save, with the "can't tell" count under it), and No caller found (automations, mostly Apex, that nothing in the scan starts), plus a Risk score worked out from those counts.
- Hottest fields are the fields touched by the most automations.
- Automation lifecycle lists the automations in the order Salesforce runs them: Before save (before-save flows, before triggers, validation), After triggers & Apex, After save (workflow, processes, after-save flows), Async & commit (roll-ups, formulas, platform events), On delete (delete flows) and Outside the save order (called code, inactive).
The compact row at the top keeps everything one click away: object chips, + Add, Dashboard / Map, Fast / Full, Customise, Re-scan, Snapshots and Export.
Reading the result: Map
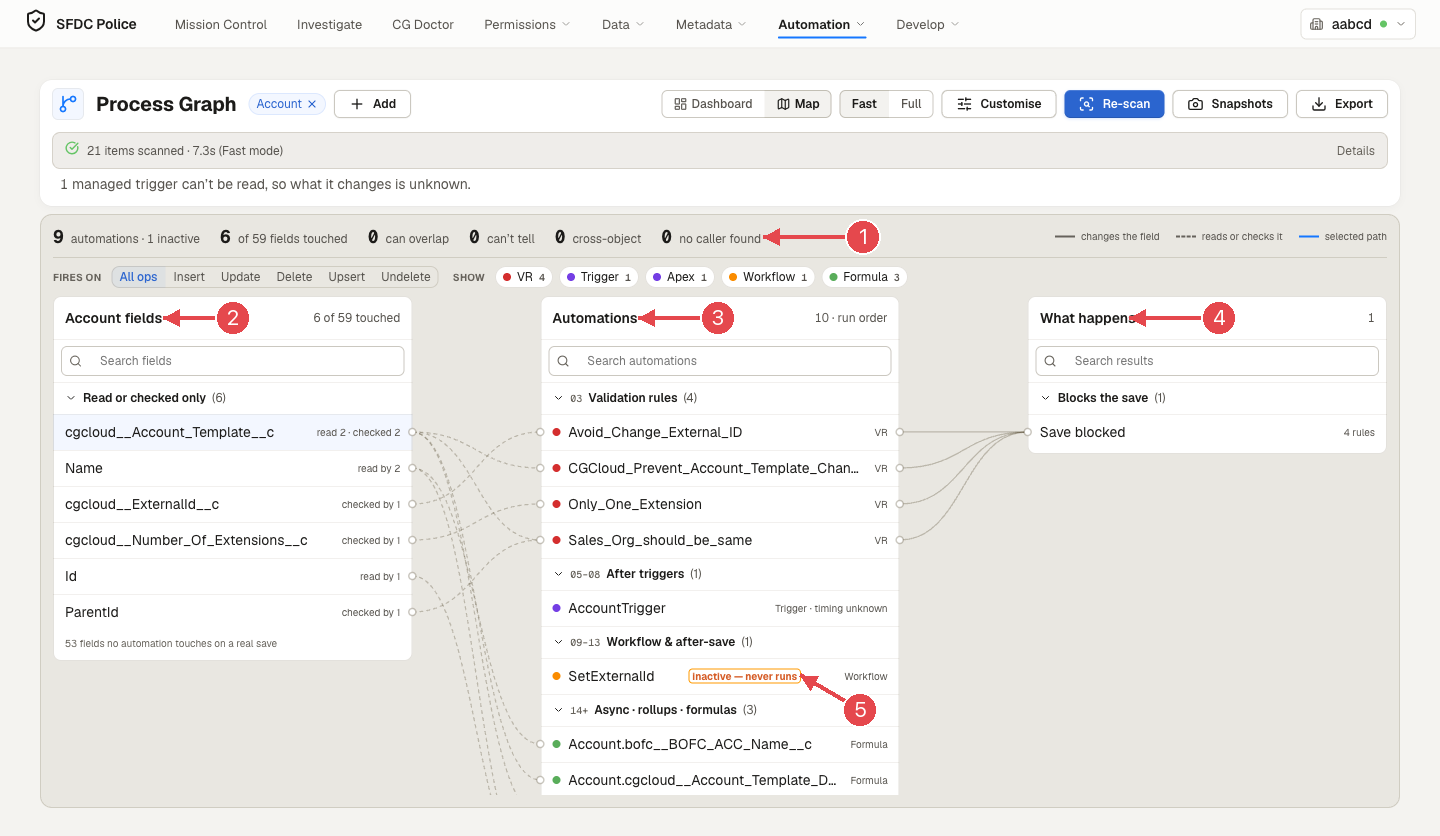
1 The summary. 2 The object's fields. 3 Automations in run order. 4 What happens. 5 An inactive automation.
The Map reads left to right: fields → automations (in run order, grouped by phase) → what happens. A solid line means the automation changes the field; a dashed line means it reads or checks it. Click a field or an automation to highlight its path. The Show chips filter by kind of automation (flows, triggers, validation rules and so on; only the kinds this object has appear).
The Map only claims what it can prove. A field gets a can overlap tag only when the scan proves two automations change it on the same record in the same save. Anything it can't prove reads can't tell, with the reason in plain words: for example, an automation's conditions are in Apex code, or part of the org wasn't read (a skipped kind, a cap, managed code).
Use case 1: "What runs when I save an Account?"
- Scan Account.
- On the Dashboard, pick the operation in Fires on (for example Update).
- Read the lifecycle top to bottom: that is the order Salesforce runs them. Expand a phase to see each automation.
Use case 2: "Something keeps overwriting this field"
- Open the Map and click the field in the left column.
- Follow its solid lines: those are the automations that change it, in run order.
- Click Open trace to step through the save. It shows which automations change the field, and which value is kept when the scan can tell. If the field is tagged can overlap, two automations both change it on the same save: fix one of them. If it says can't tell, the reason names what to check.
- To catch it in the act, use the floating panel's History → Record trail → Capture run log on a real record (panel guide).
Use case 3: "Why can't users save this record?"
- Open the Map. Under What happens, Blocks the save lists the active validation rules that can reject a save (4 on our Account), and any approval process that locks the record while it is pending. Errors thrown from Apex code are not listed there; if the error message doesn't match one of these rules, look at the triggers in the Automations column.
- Its lines lead back to the rules in the Automations column (here Avoid_Change_External_ID, CGCloud_Prevent_Account_Template_Change, Only_One_Extension and Sales_Org_should_be_same), and from each rule to the fields it checks. Sales-org rules like these are what the Data Generator ran into when it linked accounts across sales orgs.
Use case 4: Checking a release
- Before deploying, scan the objects involved and save a snapshot (Export → Save Snapshot).
- Deploy, then Re-scan with the same objects, depth and Customise choices.
- Open Snapshots and compare the saved one with the current scan: automations added and removed, and links between automations and fields added and removed. A kind of automation that either scan skipped or failed to read is listed as "Not compared" instead of showing as removed, and the compare warns when one side read only part of the org or the two cover different objects.
Use case 5: Scanning a big org without burning API calls
- Start with Fast on the objects you need. The depth card tells you whether Fast reads everything on this org.
- If you only care about flows and triggers, untick the other kinds in Customise.
- Switch to Full only when the report says Fast missed something. Before reading flows, the API budget check runs with the real number of flows. It adds a warning to the report when the read would use over 80% of the calls the org has left, and stops the scan when it would use over 95%.
Use case 6: Clean-up
- Automations tagged inactive — never runs (here a workflow, SetExternalId) are candidates for deletion.
- No caller found counts automations, mostly Apex classes, that nothing in the scan starts. Check them before deleting: a class can also be called in ways a scan can't see, which is why the wording is "no caller found", not "unused".
Tips
- Export the graph to share it or attach it to a design document.
- Field tooltips on Salesforce pages use Salesforce's own dependency data for custom fields. For standard fields, or when that data isn't available, they use your last Process Graph scan, and if that scan was partial they say "at least" rather than claiming that's all.
- Re-scan after any deployment; a graph shows the org as it was when scanned.
Process Graph is part of SFDC Police 1.1.13. Reference: Process Graph docs.